
GeoNerd Digest – 40th Edition: Geothermal Has Been Getting More Expensive, Not Cheaper
After the summer break, GeoNerd Digest is back. I am restarting with a very fresh paper that argues against something most of us in this industry repeat. Global geothermal costs have risen as deployment grew. A new ETH Zurich study puts the global experience rate at minus 20 percent, which means installed cost went up by roughly 20 percent for every doubling of cumulative installed capacity. The United States is the exception at plus 18 percent. New Zealand sits at the other end at minus 53 percent. That spread, not the global headline number, is the finding worth arguing about. The paper is titled "Experience rates of current and future geothermal power technologies" by Florian Mueller et al..


The dataset is the contribution
Most cost-curve work in geothermal has been built on thin data. The authors are direct about why earlier estimates were unreliable. The IRENA dataset that many studies rely on starts in 2008 and covers about 0.3 doublings of capacity, while the literature recommends at least three doublings before you fit an experience curve at all.
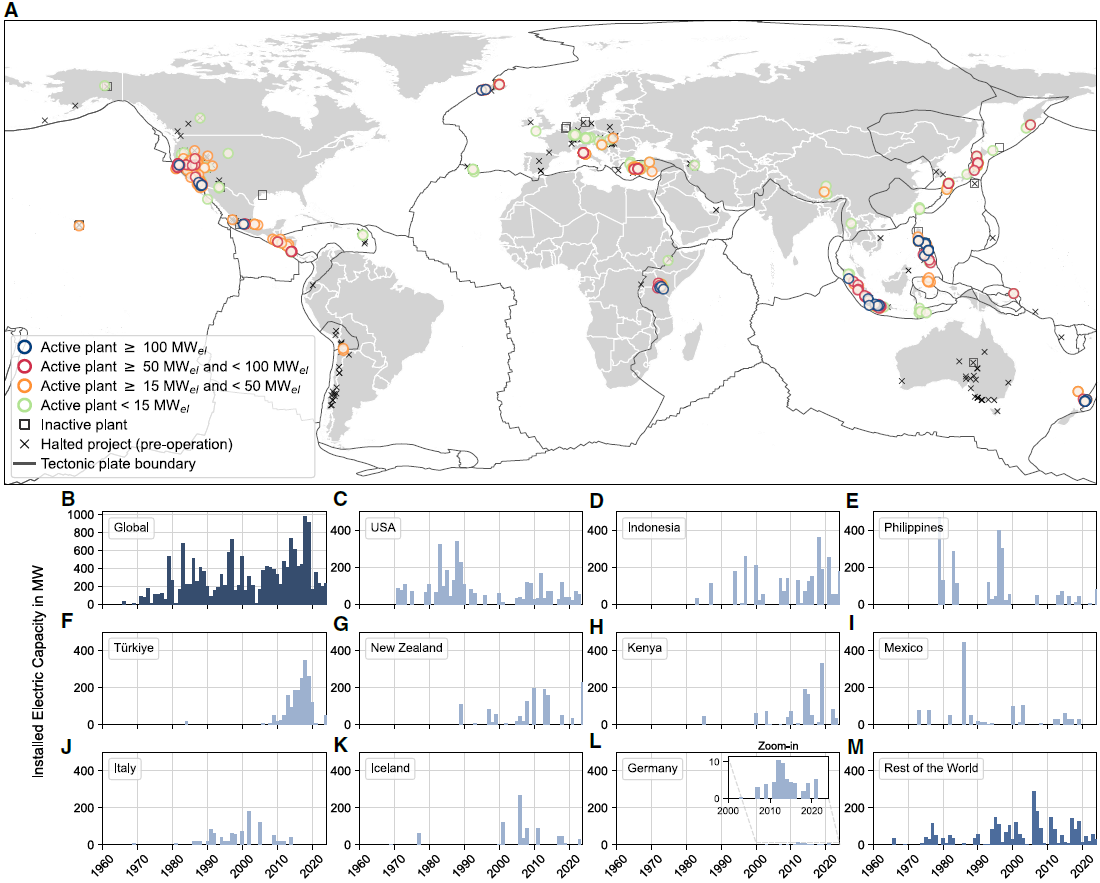
So they built a new one - every geothermal power plant commissioned worldwide since 1950 and operating before 1 January 2025, which comes to 514 plants, of which 206 carry verified installed cost data (figure below). On top of that sit 439 planned, abandoned or under construction projects. Nineteen abandoned projects that were drilled to a large extent are counted toward cumulative capacity, on the reasoning that the experience was gained even though no plant was built. That single methodological choice tells you the authors understand where geothermal learning actually happens, which is in the hole rather than on the surface.
The quantitative work is paired with 51 expert interviews conducted between October 2023 and May 2025, coded in MAXQDA, 280 labelled segments across 25 codes. The analysis code is public on GitHub and archived on Zenodo. The plant database itself is available on request, since part of it sits under a Bloomberg licence.
The global number
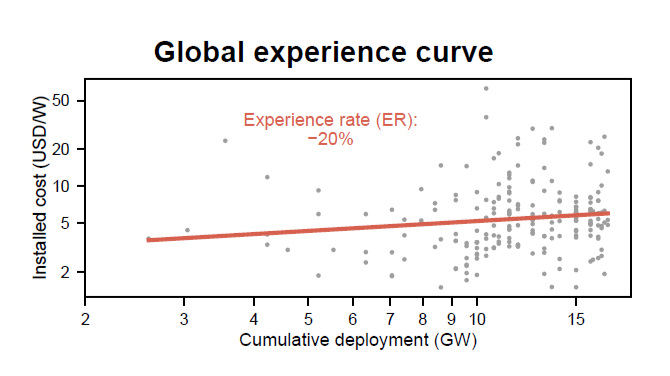
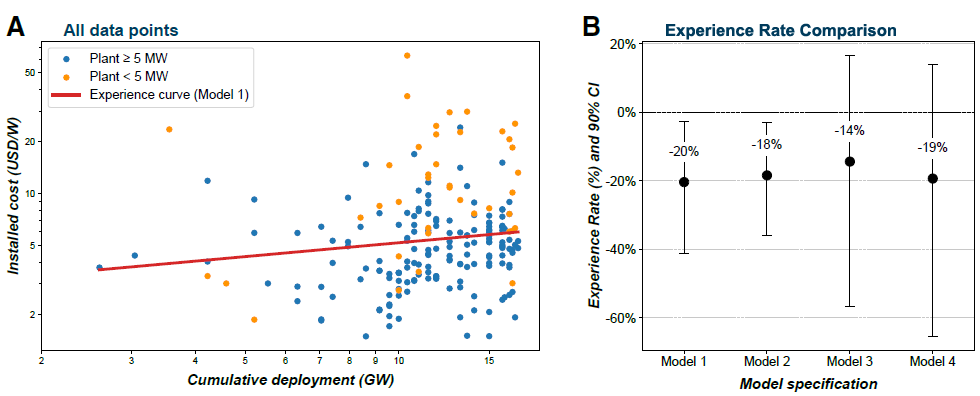
The central estimate is minus 20 percent with a 90 percent confidence interval running from minus 41.2 to minus 2.6 percent. The authors state they can say with 97 percent confidence that global costs rose rather than fell.
They then stress the result four ways. Excluding plants below 5 MW moves it to minus 18 percent. Correcting for exchange rate distortions moves it to minus 14 percent, and doing both gives minus 19 percent. The sign does not flip.
I want to be fair about the uncertainty here. The confidence intervals are wide, and the authors say why. They use plant level data rather than yearly averages, and installed costs in a single year already vary by about an order of magnitude, which is normal across large scale renewables. Wide intervals are not a defect specific to this paper. What is unusual is that the interval sits almost entirely below zero.
The country split is where it gets interesting
Seven countries had enough plants with cost data for their own curve. The United States comes out at plus 18 percent, Kenya and Germany at plus 3 percent, the Philippines at minus 7 percent, Türkiye at minus 9 percent, Indonesia at minus 36 percent and New Zealand at minus 53 percent.
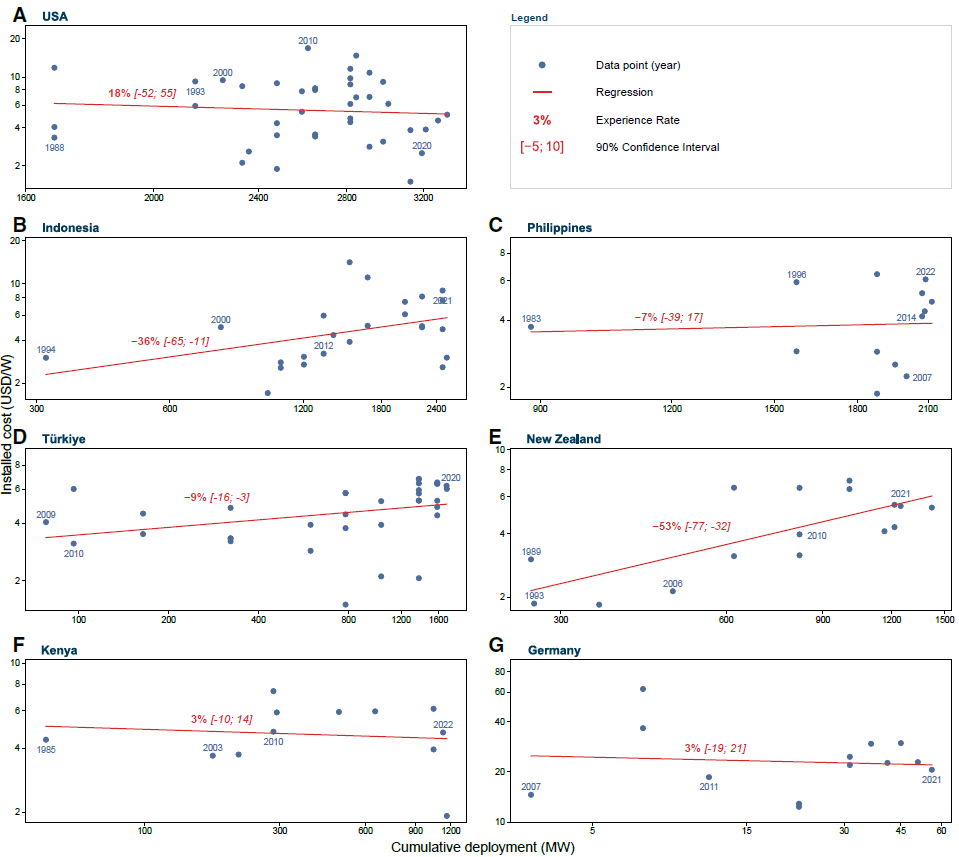
The explanations are specific rather than hand waving. New Zealand and Indonesia are dominated by diminishing productivity of new sites, with early plants sitting on near surface reservoirs and later ones pushed into harder geology, greater depth and, in Indonesia, remote regions that need their own infrastructure. Germany's positive rate comes mostly from having worked through the cost of early experimental projects, although the paper notes absolute costs there remain high. The US benefits from large homogeneous structures, comparatively stable and light regulation in sparsely populated areas, and spillovers from an active oil and gas industry.
Six factors, and one of them is ours
The interviews produce six factors that explain why learning stalls globally:
- Diminishing productivity of new sites.
- Project design complexity.
- Varying hydrogeology.
- The tacit nature of drilling knowledge.
- Regulatory density and variance.
- Knowledge transfer from the oil and gas industry, which is the only factor that pushes costs down.
Two of these should make drilling people uncomfortable, because they are about us.
Varying hydrogeology drives customisation, and one interviewee puts it plainly, saying "One can learn very little from other geothermal projects" unless they are effectively next door. The tacit nature of drilling knowledge is described as largely unique to geothermal among renewables. The expertise sits in crews and project managers, not in documents, and it takes a drilling crew around two years to become fully effective. Wind and solar installation procedures are codified and travel between sites. Geothermal largely do not.
The authors also note that resource temperatures have been declining globally and in every major country. That is the resource effect made visible. The good shallow heat was taken first.
What this means for EGS and closed loop
Since neither EGS nor closed loop has enough commercial deployment to fit a curve, the authors use a different method. Eleven experts rated the three technology families on project design complexity and need for customisation, using a framework that was validated ex post against concentrated solar, onshore wind and solar PV.
Hydrothermal came out at 2.0 complexity and 2.4 customisation. EGS scored higher on complexity at 2.5, because achieving competitive drilling speed still depends on matching bit, mud and operating parameters to local rock, and because maintaining long term permeability adds its own problem. Closed loop scored 2.4 on complexity and 2.2 on customisation, the lowest customisation of the three, since a sealed loop removes fluid rock chemistry and reservoir dependency, and thermosiphon circulation removes pumps.
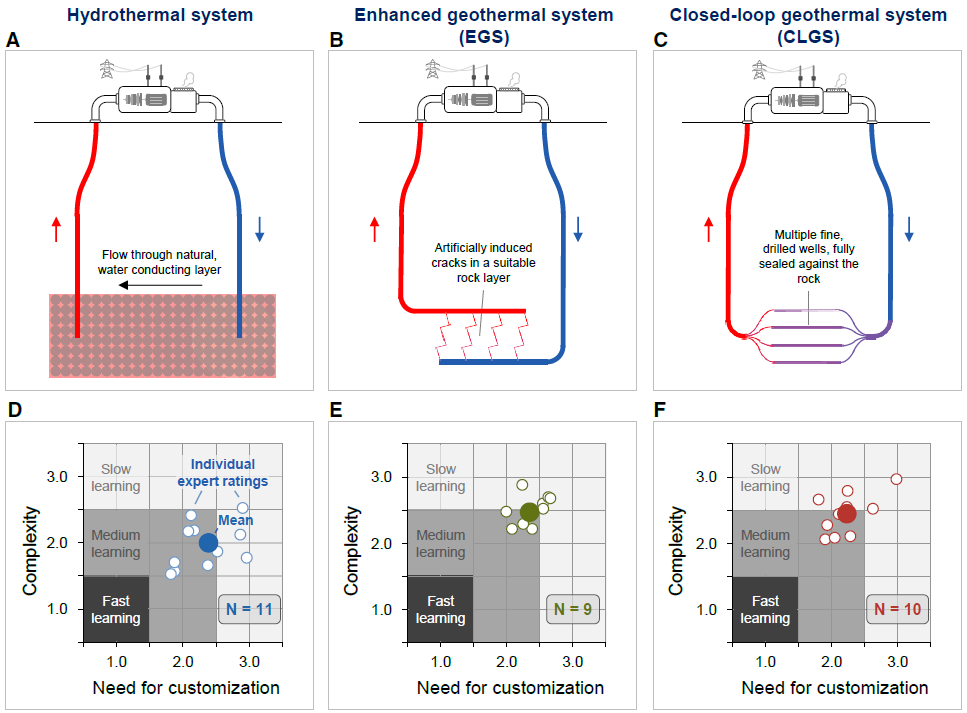
The conclusion is that neither technology is expected to produce solar style global cost declines. Both may learn faster locally, in regions with homogeneous geology and oil and gas spillovers.
I have to concede the sharpest point against closed loop here rather than skip it. The paper notes that closed loop increases total drilling distance by a factor of more than ten compared with hydrothermal. If your cost reduction story rests on drilling, then drilling ten times more metres is the whole argument, and it has to be won on metres per day and cost per metre, not on system elegance.
Where I think the picture is incomplete
The paper measures installed plant cost per watt. That is the right variable for a policy or modelling audience, and it is also a variable in which a genuine drilling breakthrough can be invisible for years.
Fervo drilled Sawtooth 7 to 5,927 metres in 21 days in July 2026. Mueller himself, speaking to ThinkGeoEnergy in August, said such improvements do not contradict the paper, because the distinction is between learning inside one component and transferring an entire project model between regions with different geology, regulation and permitting. I think that is the honest reading, and it also points to the open question.
If the barrier to transferable learning is that drilling knowledge is tacit and rock is local, then the interesting question for tool builders is how much of that tacit knowledge can be moved into hardware and control systems that behave the same way in every formation. That is a question, not a claim, and I am aware I am not a neutral party in asking it. But the framing is useful. A tool that removes a variable the crew currently has to manage by feel is not just a performance improvement. It is a transfer of knowledge from a crew into a product, which is exactly the mechanism the paper says geothermal lacks.
Two further caveats the authors state themselves. Cost data exists for 40 percent of plants and coverage thins for older projects. And for the future technologies, complexity and customisation are not the only determinants of an experience rate, only the two most important ones.
Final thoughts
The practical recommendation in the paper is aimed at energy system modellers, and it is blunt. Stop applying a single global cost level and a single experience rate across all geothermal technologies. At minimum, separate the contiguous United States from the rest of the world. If one global number must be used, use a low one.
For everyone else, the message is that geothermal cost reduction is not something that happens to the industry as deployment accumulates. It happens in specific markets where geology repeats, regulation is stable, a project pipeline keeps crews together and an oil and gas industry supplies people and equipment. Those conditions can be built. They are not automatic.
Questions for discussion
- If the US experience rate is positive mainly because of geology, regulation and oil and gas spillovers, which other market has all three, and what is missing in the ones that have two?
- For closed loop specifically, at what cost per metre does drilling ten times the distance stop being a disadvantage?
Copyright notice
This summary is based on the paper "Experience rates of current and future geothermal power technologies" by Florian Mueller, Bjarne Steffen and Tobias S. Schmidt, iScience 29, 117113 (2026), https://doi.org/10.1016/j.isci.2026.117113. The paper is published open access under CC BY 4.0.


