
GeoNerd Digest – 43rd Edition: Granite Drilling for Lithium Extraction in France
We continue in review of the most interesting papers from GRC and stay with drilling. This time we will have a look on a well in Alsace. "Geothermal in France: Setting A New Benchmark in Granite Drilling" by Barzin Chiniwala et al. documents the 8.5-in granite section of the first doublet at Betschdorf for heat and lithium co-production.


Why Alsace is a hard place to drill
The project sits inside the "Les Sources" Permis Exclusif de Recherche, targeting the Carboniferous Visean granite basement in the Soultz fault, with expected downhole temperatures of 130 to 140 °C (266 to 284 °F) and total depth at 2750 m MD (9,022 ft). This is the Soultz neighbourhood, where granite drilling has a long and expensive history.
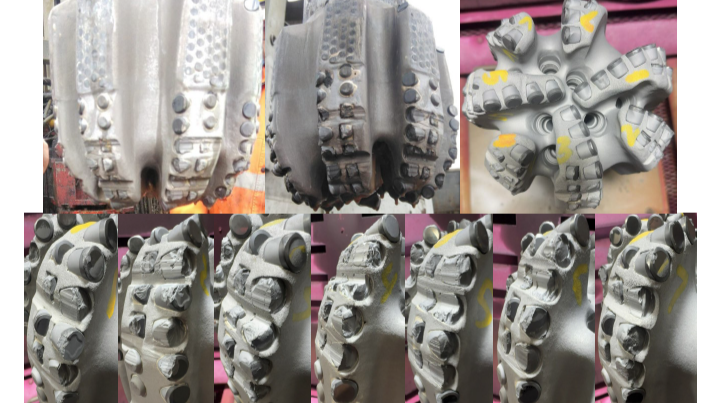
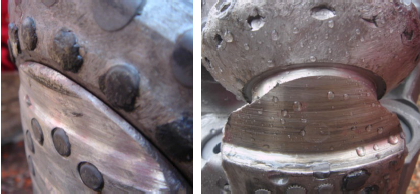
The framing of the problem is the strongest part of the introduction. Offset wells drilled with TCI roller cone bits showed excessive gauge wear, which produced under-gauge hole, cone interference and bit pinching on the following runs, with bearing and seal failure and cone loss as the downstream risk. The gauge wear photographs on page 3 are worth a long look, because they explain the entire bit selection logic that follows.
Four bits for granite
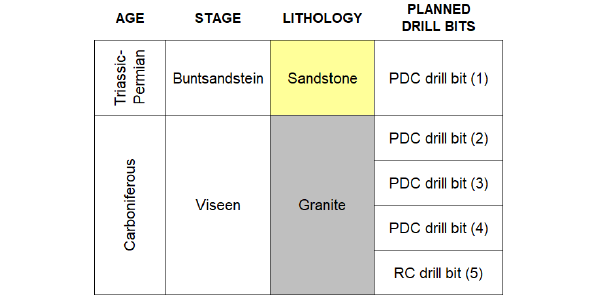
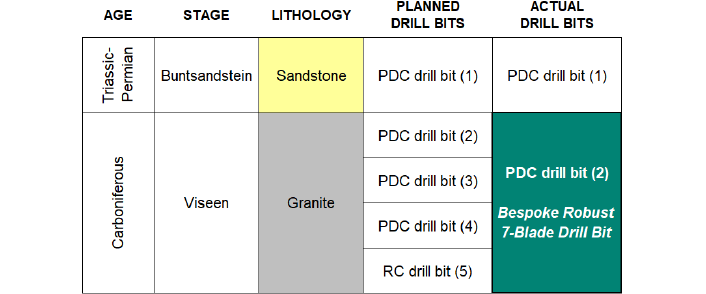
The 8.5-in interval was drilled as a tangent at 18.5 degrees inclination. Five bits were planned for the 1065 m section, one for roughly 300 m of Buntsandstein sandstone and four for roughly 700 m of granite, each prognosed at about 200 m before the cutting structure wore down. The planned bit table on page 2 is the benchmark the paper is measured against, and putting it up front is good practice.
The bit itself
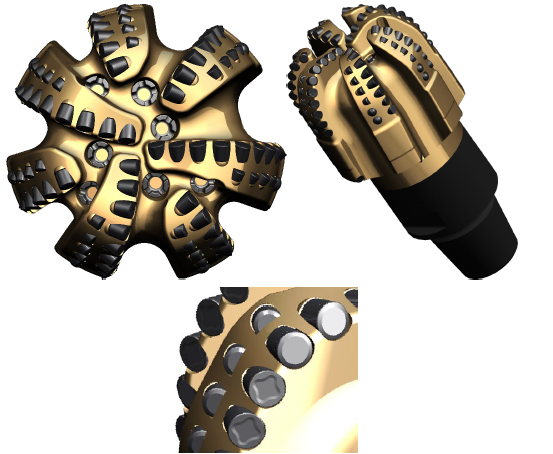
The solution was a bespoke 7-blade PDC with dual rows of 13 mm (1/2 in) cutters, large chamfers for durability, shaped diamond table geometry, a parabolic cone to spread WOB across the inner cone and nose, and a long shoulder profile. The frame came from the Utah granite campaign documented by Pauli et al. (2024) and Cripps et al. (2025). I like that the authors say this openly. The design is a transfer of a known frame into a new rock, not a clean sheet, and that is how most real improvements happen.
The digital twin, and the plot that is missing
The 3D drilling simulation workflow on page 5 integrates lab cutter testing, in-house drilling laboratory experiments, simulator output and field results. The cutter work-rate chart on page 6 is the most informative visual in the paper, because it shows load distribution across individual cutters from the bit centre out to the gauge, and the shoulder loading it predicts is exactly where the bit later wore out.
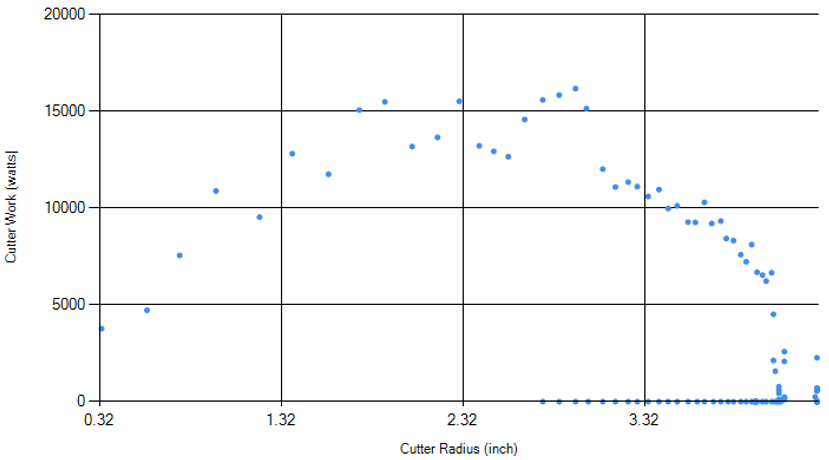
Here is my main criticism. The paper never shows predicted against actual. There is no simulated ROP curve next to the field log, and no predicted wear state next to the dull bit photographs. The feedback loop is described, the validation is asserted, and the one figure that would prove it is not there. If the digital twin is central to the design claim, the pieces of evidence should be mandatory.
What the drilling data actually shows
The meter-based performance log on page 7 is the core of the paper. The bespoke bit started in granite at 2020 m at around 11 m/hr with WOB of 8 to 10 klbs (3.6 to 4.5 t). From 2060 m the parameters were optimised, flow went from 536 to 590 gpm at 42 RPM, and ROP rose to roughly 25 m/hr with peaks above 40 m/hr. Gamma ray stayed flat through that interval, so the authors attribute the gain to drilling dynamics rather than lithology, which is a well-supported argument. From 2165 m the bit settled at about 6 m/hr, WOB was doubled to 18 to 20 klbs (8.2 to 9.1 t) at 12 to 15 k-ft-lbs torque (16 to 20 kN·m), and ROP then declined to about 4 m/hr and finally around 2 m/hr at TD, with MSE climbing throughout.
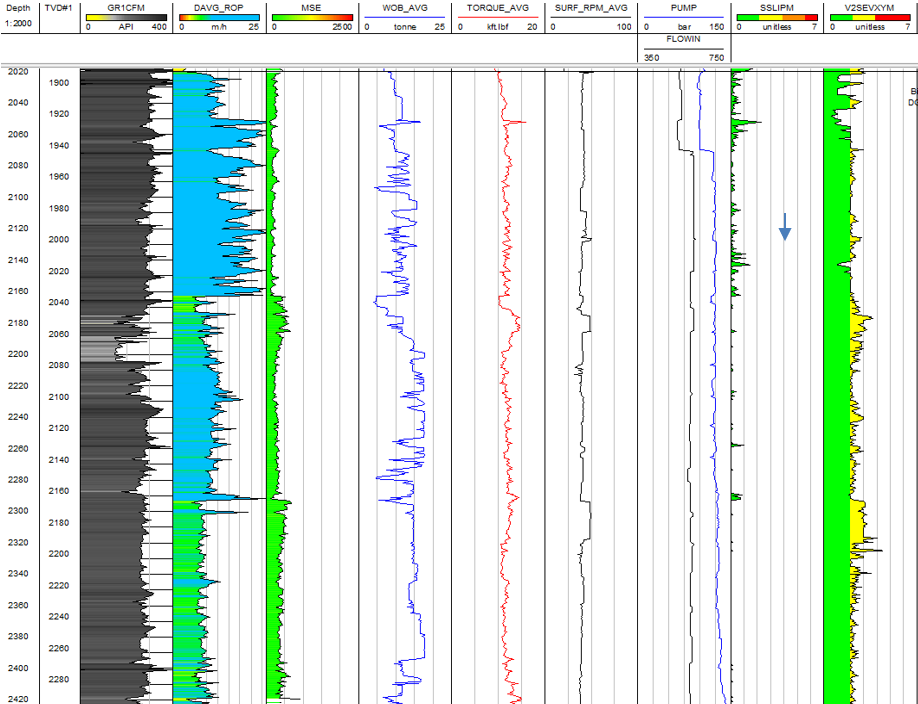
Some statements in this section do not sit together: The text says WOB was controlled to maintain a ROP of 20 m/hr. The annotation on the figure says WOB was controlled to limit ROP below 20 m/hr. The following paragraph reports an average of 25 m/hr with peaks above 40 m/hr. My reading is that the cap applied to one interval only, but the paper should say which one.
A calculation of my own, not the paper's. 730 m at an average of 7.1 m/hr implies roughly 103 hours on bottom. The fast window from 2060 to 2165 m is 105 m and about four of those hours. Take it out and the remaining 585 m to TD ran at roughly 6 m/hr. The section average is set by the slow tail, not by the optimised window.
The dull bit is a useful page
The bit came out with a dull grade of 2-6-BT-S-X-I-RO-TD, with broken cutters and ring-out concentrated on the shoulder, pulled at total depth (see the front figure above). Inner structure at 2, outer at 6. The bit reached TD and was finished when it got there.
Gauge cutting structure and gauge diameter stayed within specification, which is precisely the failure mode that destroyed the roller cones in the offsets. The bit was designed against a specific enemy and it beat that enemy.
Benchmark against what
The comparison the authors make themselves is the most valuable number in the paper. A similar PDC frame in the Utah granite drilled 752 m at 22 m/hr. France drilled 730 m at 7.1 m/hr. Almost identical distance, three times the time. The authors attribute it to the rock and say plainly that the granite in France is harder to drill.
Two sourcing notes for anyone citing this paper. The Utah comparison in the conclusions is attributed to Pauli et al. (2025), while the reference list contains Pauli et al. (2024) and Cripps et al. (2025), so one of these is wrong.
Separately, the introduction places the granite target at 2407 m TVD and 2573 m MD, while the granite run in Section 3 starts at 2020 m MD. These are probably two different things, the fault target and the basement top, but the paper does not say which.
What I take from it
The benchmark here is trip elimination, not penetration rate. Three scheduled trips removed from a 2750 m well is real money, real rig time and real personnel exposure removed, and in hard rock that is usually worth more than a few meters per hour. Durability engineering did its job and the paper proves it.
What stays unsolved is the shape of the curve. 11, then 25, then 6, then 2. Every PDC run in abrasive crystalline rock has that shape, because the cutting structure is consumed by the rock it is cutting. Better cutters and better parameter control flatten the curve and extend the run.
As long as rock destruction depends on diamond held in sliding contact against quartz, the end of a run is set by wear, and the depth you can reach is set by how much wear you can carry down there.
Questions for Discussion
- Should granite drilling results stop being publishable without UCS, quartz content and abrasiveness, so that projects can be compared rather than just celebrated?
- If a digital twin is central to a design claim, should predicted versus actual ROP be a required figure in the paper?
- At 7.1 m/hr average and 2 m/hr at TD, where is the economic break point at which one more trip is cheaper than finishing the section on a dull bit?
- Does co-production of heat and lithium move the acceptable cost per meter enough to justify a more aggressive bit and BHA spend than a heat-only project would carry?
Curious to hear your perspective, especially from anyone who has drilled the Soultz granite.
Copyright notice:
This summary is based on the paper "Geothermal in France: Setting A New Benchmark in Granite Drilling" by Barzin Chiniwala, Roger Lee, Alberto Vedovato, Vincent D., Florent COULIOU and Laurent GRASSER, GRC Transactions Vol. 50, 2026. All figures are reproduced from the paper under fair use for review purposes. Where I have recalculated or inferred something beyond the paper, I have marked it as mine.


