
GeoNerd Digest – 44th Edition: Huff-n-Puff Goes to the Field
We stay with GRC Transactions 2026 for this edition, and we go back to a company I covered a year and a half ago.
In the 16th Edition (March 2025) I wrote about Sage Geosystems and their Huff-n-Puff approach, based on two papers from the 50th Stanford Geothermal Workshop. That edition was almost entirely simulation. A three-dimensional model of a single fracture, 10 hours of injection, 10 hours of soak, 10 hours of production, temperatures swinging between 188 and 200 °C (370 and 392 °F) at the fracture/well interface, and a five-year projection of what soaking provides you.
The new paper, "A Reduced-Order Huff-n-Puff Heat Extraction Model" by Mauricio A. Rivas, et al. is the same team with the thing I was waiting for after that edition. Field data: eighteen consecutive injection-production cycles at a grid-connected facility in South Texas, operated on a schedule deliberately chosen to emulate a single-well geothermal heat-extraction duty, plus a reduced-order model calibrated against that record.

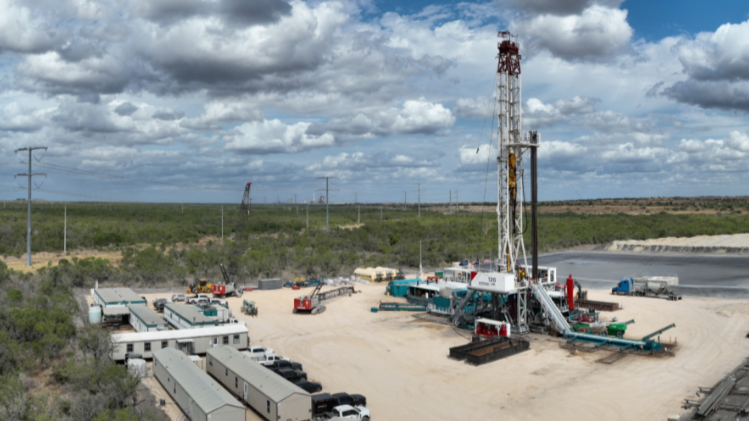

A grid-connected well in South Texas, run like a geothermal well
The test bed is a single deep well that stores energy mechanically. Fluid injected at high rate pressurises a stimulated fracture system, and that stored pressure comes back as controlled flowback during production. Sage first demonstrated this at a pilot well in South Texas in 2023. The new campaign ran at a separate, full-scale, grid-connected facility of similar subsurface design, which matters more than it sounds, because reproducing the behaviour at a second installation is the first evidence of scalability.
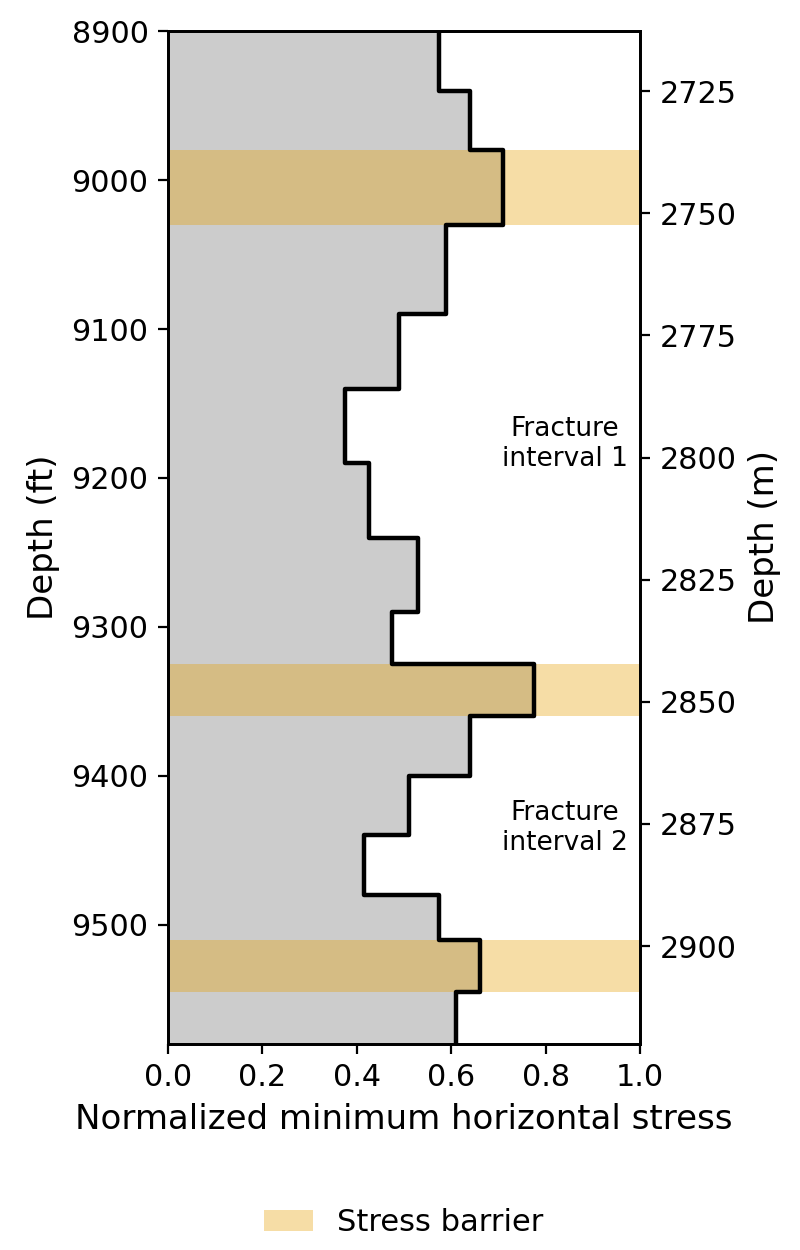
The geomechanical setting is shown in Figure 1 below. Three stress barriers bound the stimulated region between roughly 8,900 and 9,550 ft (2,710 and 2,910 m) and limit vertical fracture growth, defining two stimulated intervals. Those same two intervals become the two fracture tanks in the model later on, and the stress profile fixes the fracture closure stress the model uses. I like this because the geomechanics constrains the model rather than the other way round.
The cycles were deliberately run as a heat-extraction duty rather than as a storage demonstration, and deliberately without a soak. Injection passes straight into production, separated only by a short zero-flow turnaround worth a few percent of the cycle. That pause is not an accident either. It is long enough to expose the initial post-production pressure rebound, which the authors read as the pressure analogue of inter-cycle thermal recovery.
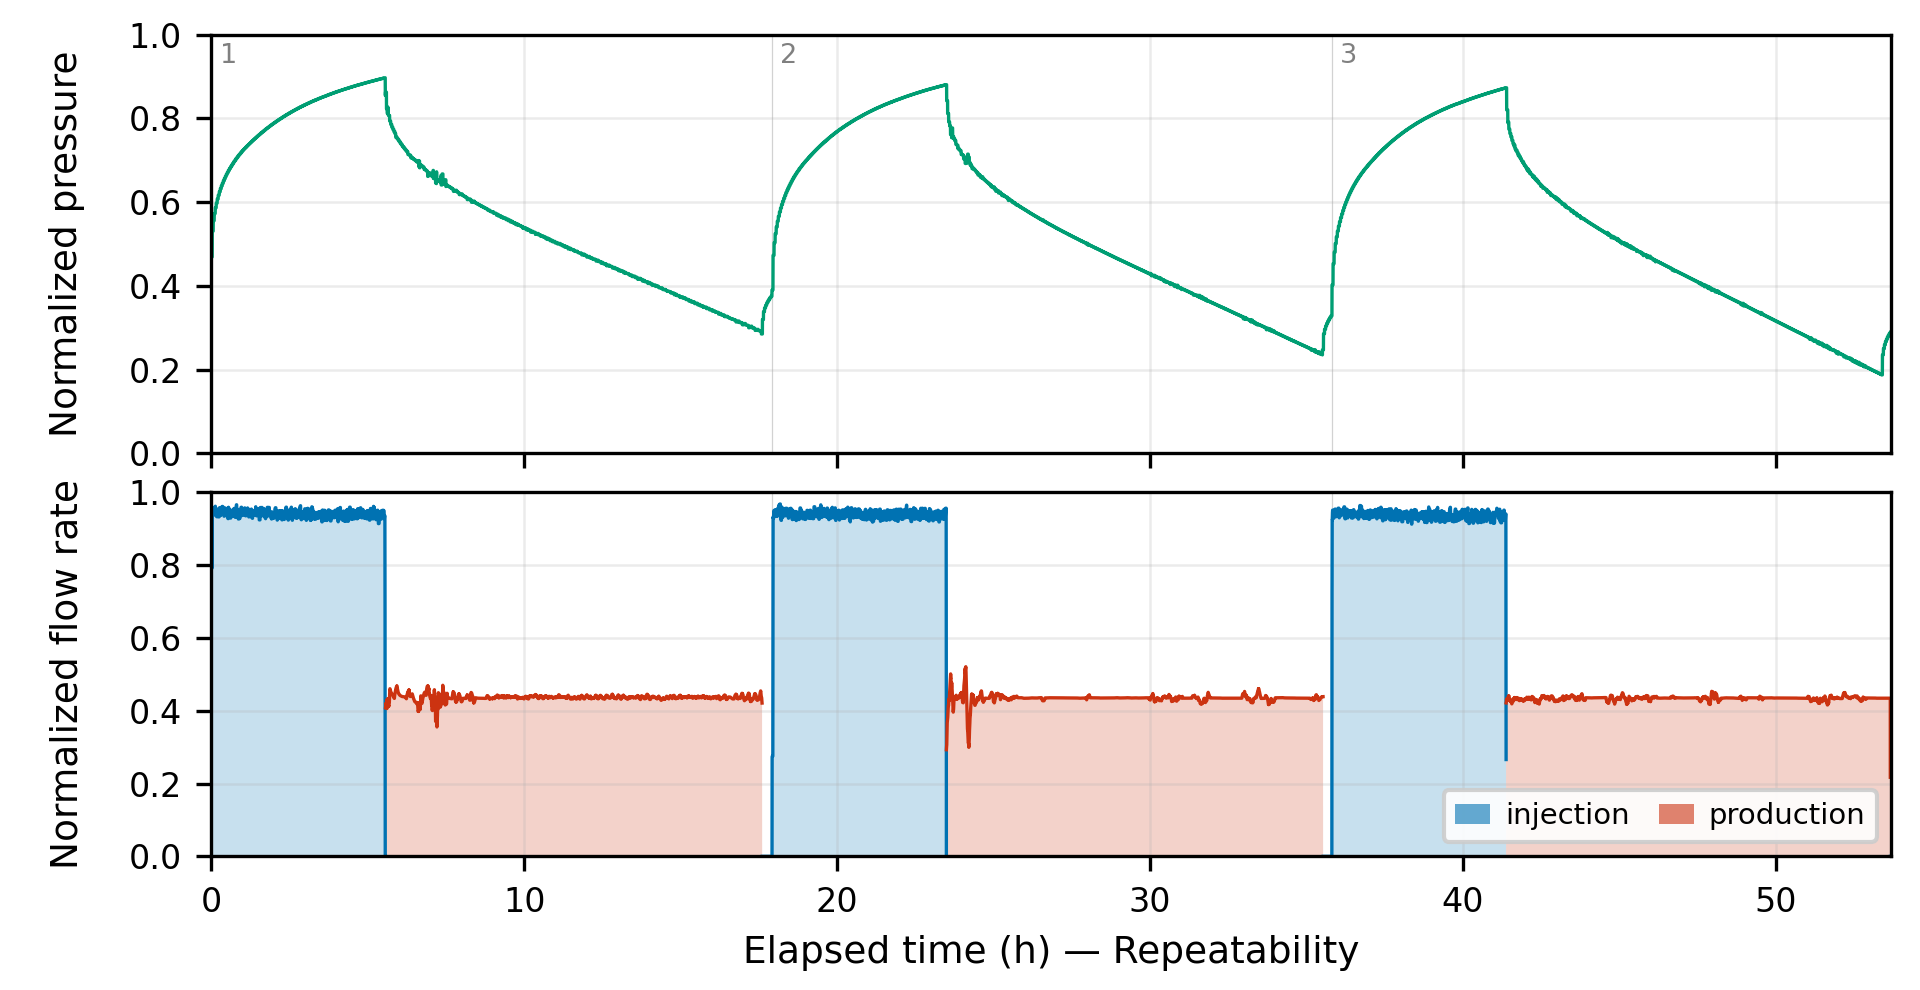
The per-cycle numbers in Table 1 are consistent to a degree that is almost boring, which is the point. Injected volume held near 3,600 bbl (about 570 m³) with produced volume essentially matching it, water recovery of 99.7 to 100.0 %, round-trip subsurface efficiency of 84 to 86 %, injection near 11 bpm sustained for 5.6 hours, and production near 5 bpm sustained for 12.0 hours.
For anyone who read the 16th Edition, those rates convert to roughly 29 kg/s on injection and 13 kg/s on production (my conversion, not the paper's). The earlier Stanford model assumed about 8 kg/s per fracture, with twelve fractures needed for a commercial 100 kg/s. So this well is already operating at a rate in the right order of magnitude, with two stimulated intervals instead of twelve.
Eighteen operational cycles
Extending from three cycles to eighteen is where the paper get its credibility. Across the full run the rate schedule, the cycle timing and the sustained production duration each vary by less than a percent, so the pressure and flow records overlay almost exactly. The well completes just over one full cycle per day, about 1.3 cycles per day, which the authors later use as the measure of how hard the system is being worked.
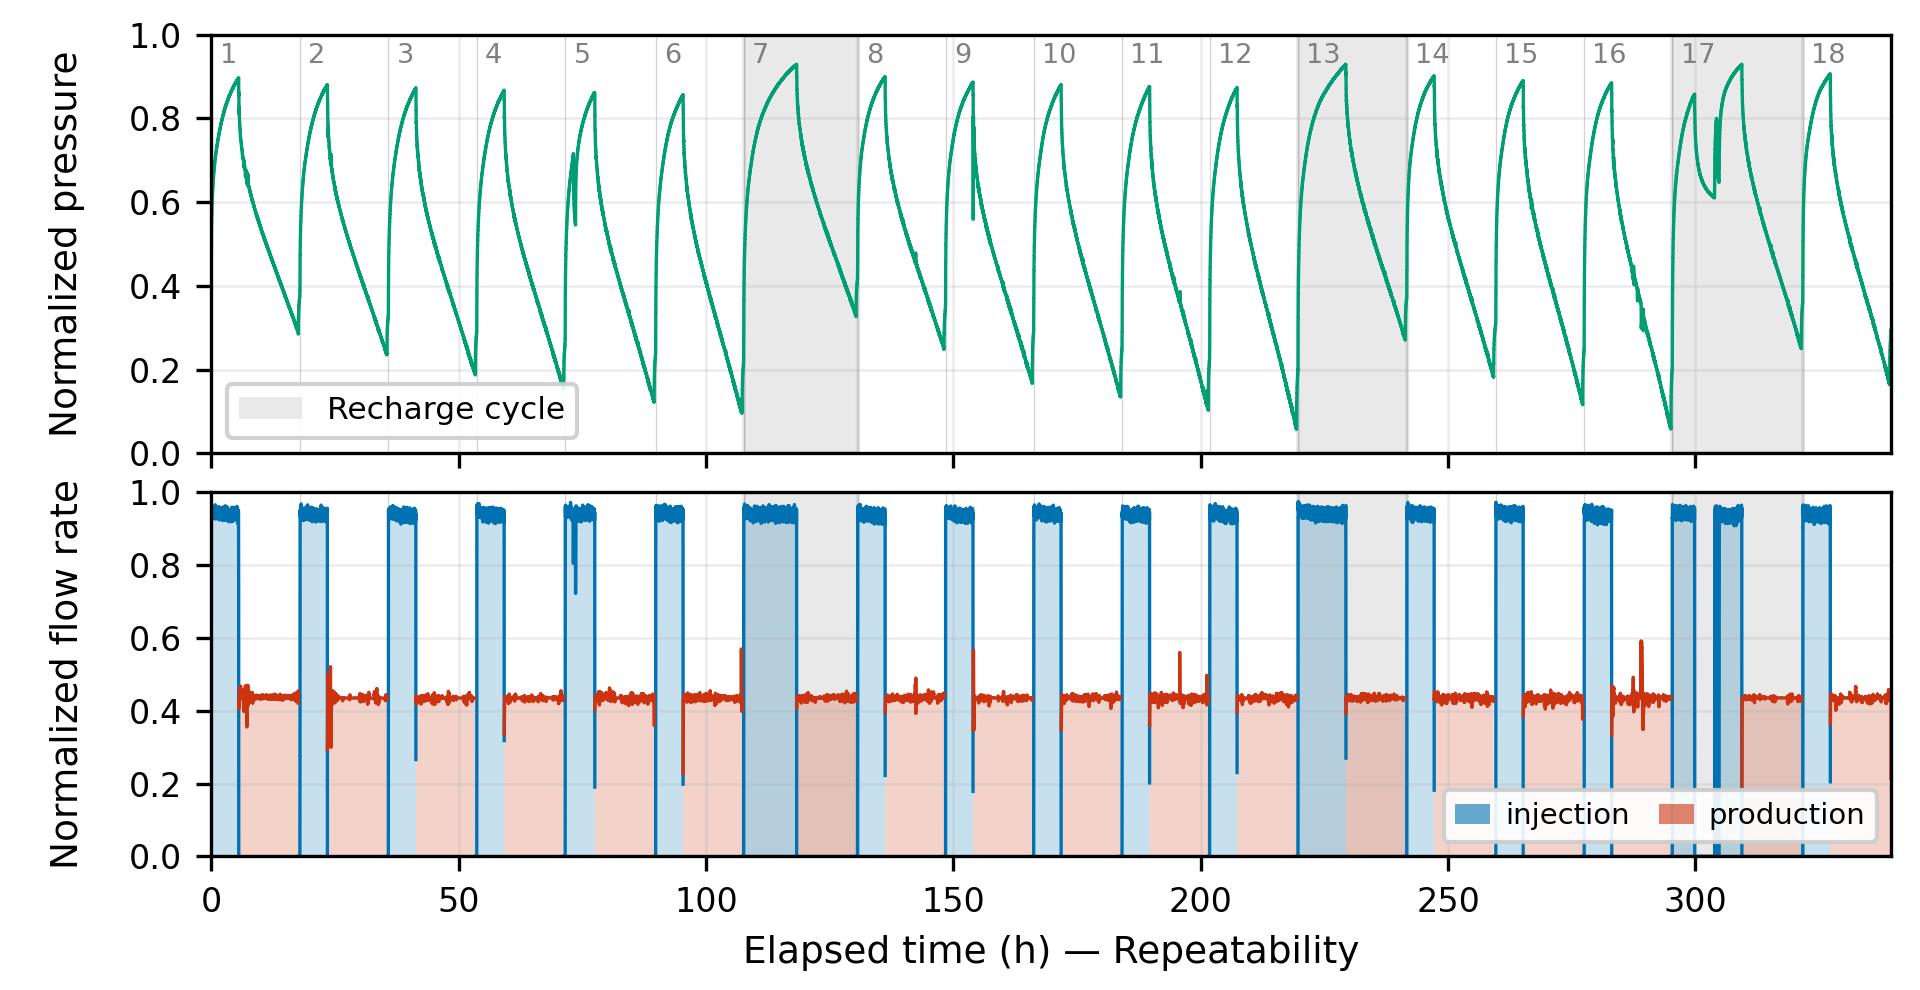
Two details in this figure deserve more attention than they get.
The first is the recharge. Left alone, the per-cycle pressure floor drifts downward as fluid leaks off into the formation. A recharge cycle is identical to a normal one except for a longer injection phase that supplies make-up volume, and a single recharge does not fully offset the intervening leak-off. Applied periodically it holds the operating pressure inside a bounded band. The campaign continued past the window shown, and without further recharge the floor kept drifting lower. That is a clean, negative-evidence demonstration that the recharge is what holds the band, not something about the cycle itself. Very few field papers bother to show you the case where they stopped doing the thing.
The second is Cycle 17. A passing thunderstorm tripped the variable-frequency drive and briefly interrupted injection, giving a double-peaked pressure signature. The authors left it in, and because the model is driven by the measured flow it reproduces the irregular cycle too. A weaker paper would have quietly avoided mentioning that cycle.
Two tanks and a halo
The model is two coupled reduced-order models (ROMs). A nonlinear hydromechanical lumped-parameter ROM resolves flow and pressure, and a thermal ROM resolves fracture heat transport. The coupling runs one way, with the hydromechanical side supplying the flow history that drives the thermal side.
The hydromechanical ROM treats the wellbore as a storage tank driven by wellhead flowrate, connected through near-wellbore resistances to each fracture, with each fracture leaking off through a halo resistance to the far-field pore pressure. Fracture pressure follows a power-law compliance relation with closure stress, stiffness and an exponent per fracture. For this site the two stress-bounded intervals reduce the general formulation to N = 2.
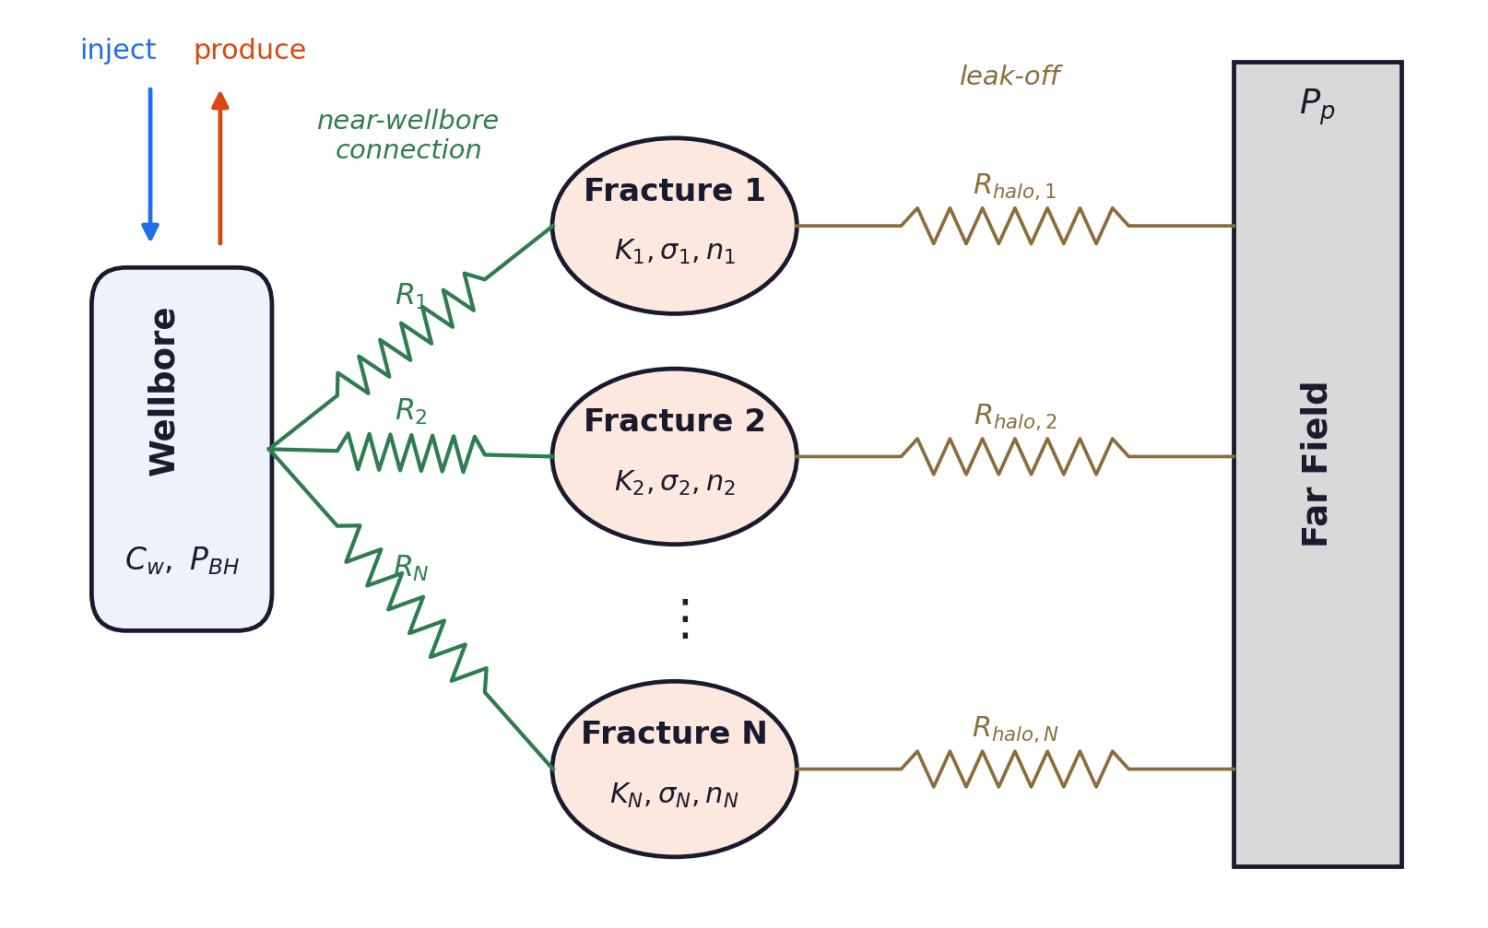
The elegant part is that the huff-n-puff cycle enters only through the sign and magnitude of the wellhead flowrate. Charging, shut-in and discharge are described by the same equations with no switching logic.
From pressure to heat, and the line the authors refuse to cross
The South Texas site has a modest geothermal gradient and sits below power-production grade. There is no produced-temperature data. So the thermal result is the calibrated flow history driving the thermal ROM under assumed power-grade conditions, a reservoir near 200 °C (392 °F) with 90 °C (194 °F) injectate.
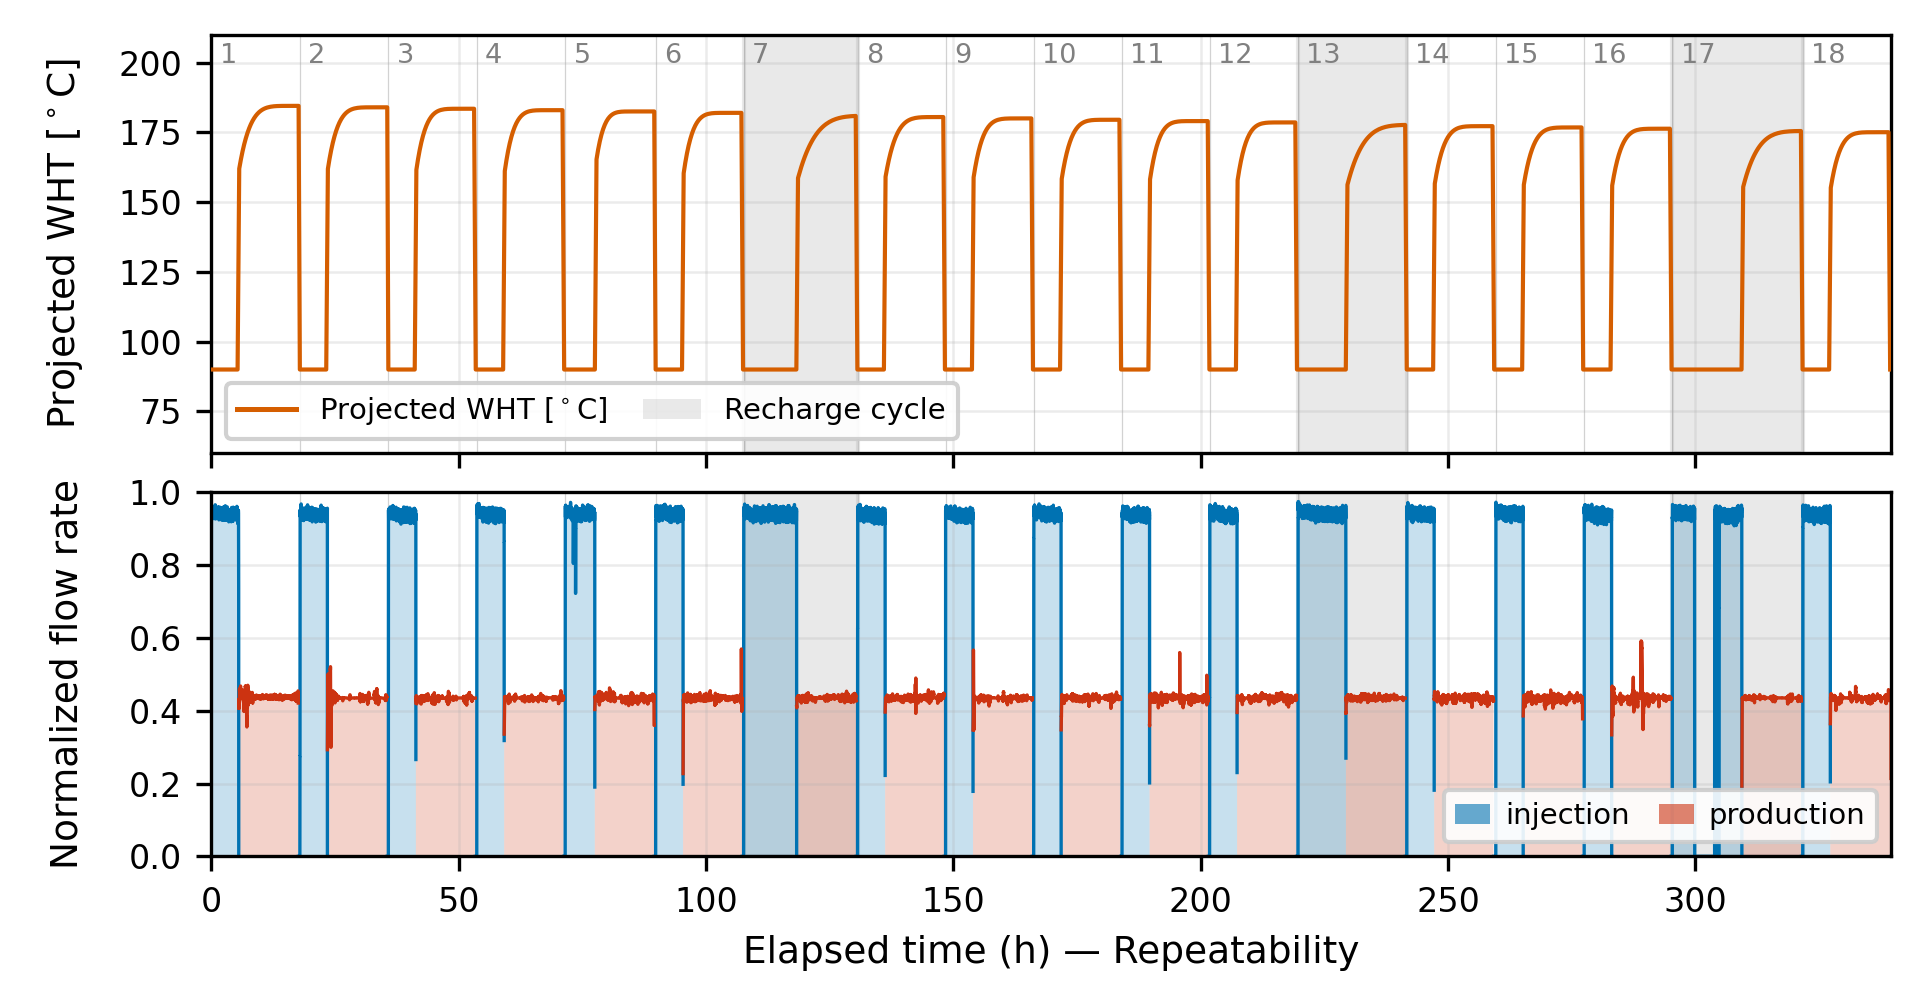
The projected wellhead temperature rises through each production phase to roughly 180 °C (356 °F), falls back to injectate temperature during injection and turnaround, and the peak declines gradually from cycle to cycle as the near-well region cools. Backpressure is held above saturation pressure throughout production so the flow stays single-phase liquid, consistent with the assumptions in both models.
Cadence is variable
An interesting idea in the paper is that cadence, meaning how hard and how often you cycle the well, is a design variable to be matched to project life; not a fixed value.
The benchmark is GeneSys at Horstberg in northern Germany, still the only field case where single-well huff-n-puff has actually extracted heat at around the 1 MWth scale. GeneSys ran gentle weekly cycles aimed at a multi-decade district-heating duty, with modelling projecting thermal output declining only gradually from about 1.3 to 0.8 MWth over twenty-five years. The Sage campaign is at the opposite end from cadence point of view.
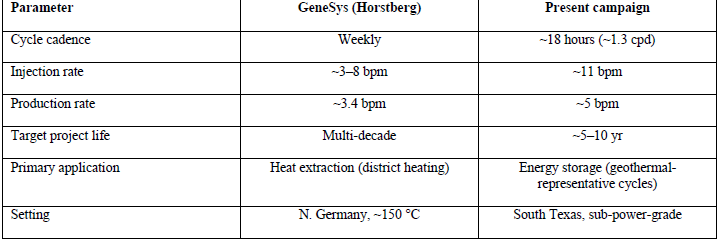
GeneSys also serves as a reality check on the thermal projection, and the authors use it that way. It is independent evidence that a stimulated fracture stays highly conductive across many cycles under large cyclic pressure swings, which is the mechanical robustness the whole concept rests on.
Three things worth revisiting
The water-recovery cap. The paper reports water recovery of 99.7 to 100.0 %, but notes the ratio is capped at 100 % by definition. Produced volumes were around 3,620 and 3,610 bbl against about 3,600 bbl injected, so two of the three cycles had raw ratios above unity, with the surplus drawn from fluid stored in earlier cycles. Cumulative volume balance over eighteen cycles is what tells you the real leak-off rate, while the capped metric may hide that.
Normalised axes everywhere. Pressure, stress and flow are all normalised. I understand why a commercial operator does this. It does mean nobody outside Sage can independently check the absolute pressure work, and the paper should be read with that in mind.
A five to ten year project life. The paper justifies the aggressive cadence as a deliberate match to a 5 to 10 year horizon. For a well costing what a 2,900 m stimulated well costs, that is a short amortisation window, and it is stated as a design premise which is not defended economically. The GeneSys multi-decade duty and this one are presented as two points on a curve. But both ends of the curve has very different capital intensity.
None of these undermine the central result. The field record and the calibration are solid, and the paper is very disciplined about separating what was measured from what was modelled.
Final thoughts
Eighteen months ago I described Huff-n-Puff as a promising cycle supported by a three-dimensional thermal model and a five-year projection. Does it behave in the field the way it behaves in the simulator?
For the mechanical half of the cycle the answer is now yes, and with better numbers than were expected. Eighteen back-to-back cycles with sub-percent variation in schedule, 84 to 86 % round-trip subsurface efficiency, and a two-tank model with fixed closure stresses matching every one of them without refitting.
The thermal half is still a projection, and the one decision I keep returning to is the choice to run this campaign without a soak. The 2025 paper I reviewed in the 16th Edition found a soak worth roughly 5 °C in maximum cycle temperature after five years.
Questions for discussion
- If mechanical energy storage and geothermal heat extraction really are one operation at two cadences, does that change how we should be financing early wells?
- Is round-trip subsurface efficiency of 84 to 86 % high enough to for commercial operation?
- Periodic recharge keeps the pressure floor inside a band over eighteen cycles. Over five years of daily cycling, how much make-up water does that actually add up to, and where does it come from in a water-stressed basin?
As always, suggestions for future editions are welcome.
Copyright Notice:
This summary is based on the paper "A Reduced-Order Huff-n-Puff Heat Extraction Model" by Mauricio A. Rivas, Douglas Simpkins, Victoria McGuire and Lev Ring of Sage Geosystems, published in GRC Transactions, Vol. 50, 2026. All figures and tables are reproduced from the paper under fair use for review purposes only.


